On Top of the World
COVID-19 got me thinking about my favorite band (no, I'm not hip), Imagine Dragons, and the song On Top of the World.

What does COVID-19, highest mountains, deepest rivers, and being on top of the world have to do with econometrics? Good question. The answer is turning points.
I'm beyond sure that we are all sick (no pun intended) of seeing graphs about "flattening the curve."
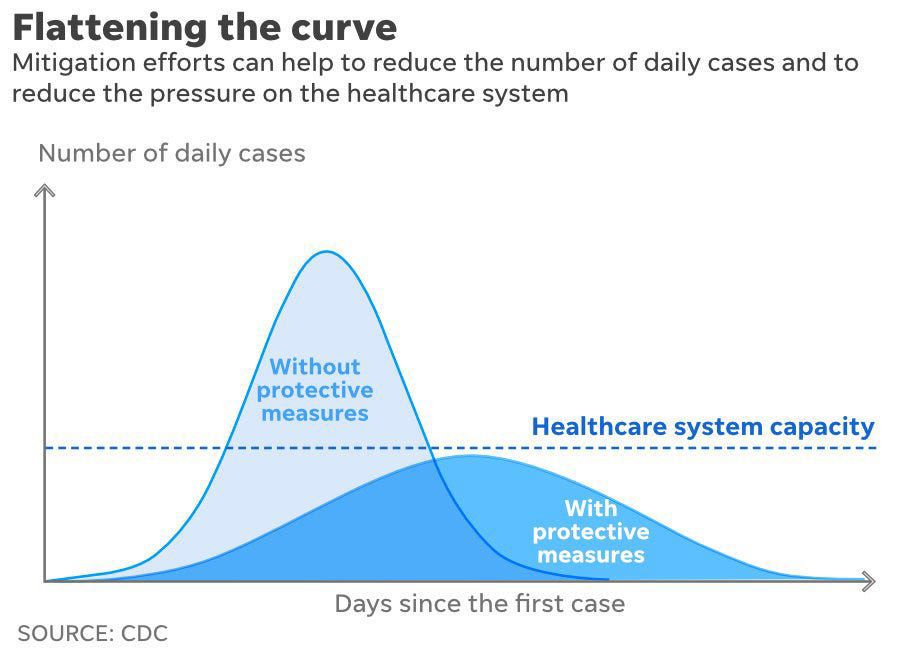
The shapes of these curves are presumably fundamental to the question about when to "re-start" the economy. So, ideally we would like to use the current data to "fit" the curve and estimate when we can expect the number of new cases to begin to fall. This is a problem of estimating a turning point. Stated differently, the problem is to find the "highest mountain," to know when we will be "on top of the world."
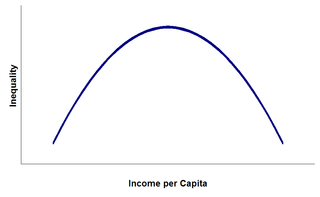
Estimating turning points has a long history in econometrics and statistics. The most famous example of which I am aware is the so-called Kuznets' curve, the hypothesized inverted-U shaped relationship between country-level income inequality and per capita income (Kuznets 1955).

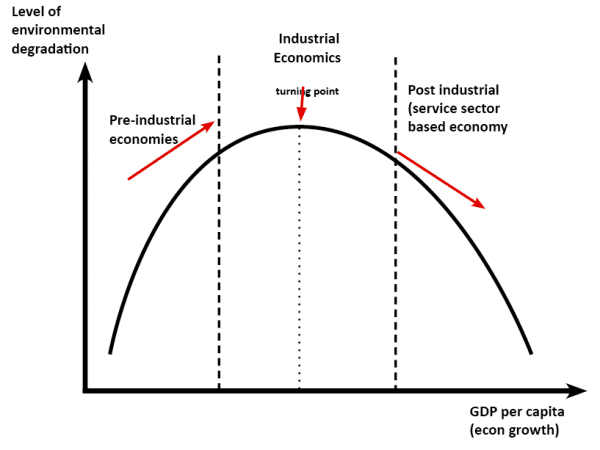
This idea then spawned the so-called Environmental Kuznets curve (e.g., Millimet et al. 2003).
 Of course, there is also Mincer's age-earnings profile (Mincer 1958).


Turning (pun intended this time!) back to the econometrics, when a theory posits a turning point, how do we go about estimating where this turning point occurs? While there certainly are more complicated approaches (semi-parametric partially linear models, or fully nonparametric methods), the most common approach is to estimate a regression model with a quadratic term, such as
y = a + bx + cx2 + e,
and then solve the first-order condition, yielding the following expression for the turning point
x* = -b/2c.
Know all of this? Yes, I'm sure you do. But, don't make me start singing Guns 'N Roses.
 At this point (the puns keep writing themselves!), we can estimate x* by using a plug-in estimator; a fancy name for replacing b and c with their OLS counterparts.

What are the properties of this estimator of x*? That is the point (again!) of this post.
First and foremost, we need to recognize that what we have produced is an estimate of x*. All too often in papers authors simply report x*-hat and leave it at that. Because it is an estimate, it has a standard error. And, this standard error should be reported. But, x*-hat is a non-linear function of the OLS estimates which complicates matters.
The usual approach to getting a standard error of a non-linear function of random variables is the Delta Method. Again, most of you are probably aware of the Delta Method and its formula
 where f() is some nonlinear function of the OLS coefficients. Some you may have even used it. If you have used -nlcom- in Stata, then you have definitely used it. But, how many know where this formula comes from?

Well, let me tell you. The Delta Method proceeds by approximating the non-linear function, f(), using a first-order Taylor series expansion.

The first-order approximation is linear in the OLS estimates. Thus, we can easily compute the exact standard error of this approximation to x*-hat.

This means the Delta Method produces biased estimates of the standard error. Uh oh!

But, there is an alternative.

A far less well known solution that yields a standard error of x*-hat, not a linear approximation of it, is available. It is known as the Fieller method (Fieller 1932). And ... it is ugly.


Joe Hirschberg is a former professor at SMU, now at the University of Melbourne. He and his colleague, Jenny Lye, have written several excellent papers on this topic (e.g., Hirschberg & Lye 2010; Lye & Hirschberg 2018). And, there exists Stata (and R) code. But, Stata! See the -fieller- command in Stata.

Now that we have inference squared away, what about other properties of the plug-in estimator of x*? Well, it's not unbiased.

Even if the OLS estimates of b and c are unbiased, non-linear functions are not necessarily unbiased (although they are consistent). Fieller also showed that the moments of x*-hat do not even exist. One solution is to not use the plug-in estimator, and instead use the median of the distribution F(t) in the image from my lecture notes above.

The final point I want to make is that while the Delta and Fieller Methods produce standard errors for the estimated turning point, and the Fieller method also spits out a potential alternative estimate of the turning point, there are other recently developed methods that provide formal tests of whether or not a turning point even exists. Testing this is equivalent to testing whether the relationship between y and x is weakly monotonic.
Typically, researchers are informal about this; they simply look to see whether the OLS estimates of b and c are of opposite signs. However, a formal test requires conducting a joint hypothesis test of this possibility. For example, to test for the presence of an inverted-U shape, we should test
Ho : b>0, c<0
Ha: Not Ho
This is not trivial. We typically eschew null hypotheses that involve one inequality, let alone two.

Again, the heavy lifting has been done for us, by Lind & Mehlum (2010). In keeping with the sub-theme of this post, the paper even has a very cool title that you too will appreciate (oh, the puns)! And, even cooler, they have Stata code, see the -utest- command.
It does not take a pandemic to showcase the importance of estimating non-monotonic relationships, particularly in economics. However, it would be a nice silver lining if it helps shine a light on ways to perhaps elevate our statistical analysis of such relationships.
 Be well!
References
Fieller, E. C. (1932), "The Distribution of the Index in a Normal Bivariate Population," Biometrika, 24, 428-440
Hirschberg, J. and J. Lye (2010), "A Geometric Comparison of the Delta and Fieller Confidence Intervals," The American Statistician, 64(3), 234-241
Kuznets, S. (1955), "Economic Growth and Income Inequality," American Economic Review, 45(1), 1-28
Lye, J. and J. Hirschberg (2018), "Ratios of Parameters: Some Econometric Examples," Australian Economic Review, 51(4), 578-602
Millimet, D.L., J.A. List, and T. Stengos (2003), "The Environmental Kuznets Curve: Real Progress or Misspecified Models?" Review of Economics and Statistics, 85, 1038-1047
Mincer, J. (1958), "Investment in Human Capital and Personal Income Distribution," Journal of Political Economy, 66(4), 281-302
"I've had the highest mountains
I've had the deepest rivers ...
Been dreaming of this since a child
Been dreaming of this since a child
I'm on top of the world"
And, of course, that led back to econometrics, where all good roads lead.
What does COVID-19, highest mountains, deepest rivers, and being on top of the world have to do with econometrics? Good question. The answer is turning points.
I'm beyond sure that we are all sick (no pun intended) of seeing graphs about "flattening the curve."
The shapes of these curves are presumably fundamental to the question about when to "re-start" the economy. So, ideally we would like to use the current data to "fit" the curve and estimate when we can expect the number of new cases to begin to fall. This is a problem of estimating a turning point. Stated differently, the problem is to find the "highest mountain," to know when we will be "on top of the world."
Estimating turning points has a long history in econometrics and statistics. The most famous example of which I am aware is the so-called Kuznets' curve, the hypothesized inverted-U shaped relationship between country-level income inequality and per capita income (Kuznets 1955).
This idea then spawned the so-called Environmental Kuznets curve (e.g., Millimet et al. 2003).

Turning (pun intended this time!) back to the econometrics, when a theory posits a turning point, how do we go about estimating where this turning point occurs? While there certainly are more complicated approaches (semi-parametric partially linear models, or fully nonparametric methods), the most common approach is to estimate a regression model with a quadratic term, such as
y = a + bx + cx2 + e,
and then solve the first-order condition, yielding the following expression for the turning point
x* = -b/2c.
Know all of this? Yes, I'm sure you do. But, don't make me start singing Guns 'N Roses.
What are the properties of this estimator of x*? That is the point (again!) of this post.
First and foremost, we need to recognize that what we have produced is an estimate of x*. All too often in papers authors simply report x*-hat and leave it at that. Because it is an estimate, it has a standard error. And, this standard error should be reported. But, x*-hat is a non-linear function of the OLS estimates which complicates matters.
The usual approach to getting a standard error of a non-linear function of random variables is the Delta Method. Again, most of you are probably aware of the Delta Method and its formula

Well, let me tell you. The Delta Method proceeds by approximating the non-linear function, f(), using a first-order Taylor series expansion.


This means the Delta Method produces biased estimates of the standard error. Uh oh!


Joe Hirschberg is a former professor at SMU, now at the University of Melbourne. He and his colleague, Jenny Lye, have written several excellent papers on this topic (e.g., Hirschberg & Lye 2010; Lye & Hirschberg 2018). And, there exists Stata (and R) code. But, Stata! See the -fieller- command in Stata.
Now that we have inference squared away, what about other properties of the plug-in estimator of x*? Well, it's not unbiased.
Even if the OLS estimates of b and c are unbiased, non-linear functions are not necessarily unbiased (although they are consistent). Fieller also showed that the moments of x*-hat do not even exist. One solution is to not use the plug-in estimator, and instead use the median of the distribution F(t) in the image from my lecture notes above.
The final point I want to make is that while the Delta and Fieller Methods produce standard errors for the estimated turning point, and the Fieller method also spits out a potential alternative estimate of the turning point, there are other recently developed methods that provide formal tests of whether or not a turning point even exists. Testing this is equivalent to testing whether the relationship between y and x is weakly monotonic.
Typically, researchers are informal about this; they simply look to see whether the OLS estimates of b and c are of opposite signs. However, a formal test requires conducting a joint hypothesis test of this possibility. For example, to test for the presence of an inverted-U shape, we should test
Ho : b>0, c<0
Ha: Not Ho
This is not trivial. We typically eschew null hypotheses that involve one inequality, let alone two.
Again, the heavy lifting has been done for us, by Lind & Mehlum (2010). In keeping with the sub-theme of this post, the paper even has a very cool title that you too will appreciate (oh, the puns)! And, even cooler, they have Stata code, see the -utest- command.
It does not take a pandemic to showcase the importance of estimating non-monotonic relationships, particularly in economics. However, it would be a nice silver lining if it helps shine a light on ways to perhaps elevate our statistical analysis of such relationships.
References
Fieller, E. C. (1932), "The Distribution of the Index in a Normal Bivariate Population," Biometrika, 24, 428-440
Hirschberg, J. and J. Lye (2010), "A Geometric Comparison of the Delta and Fieller Confidence Intervals," The American Statistician, 64(3), 234-241
Kuznets, S. (1955), "Economic Growth and Income Inequality," American Economic Review, 45(1), 1-28
Lind, J.T. and H. Mehlum (2010), "With or Without U? The Appropriate Test for a U Shaped Relationship," Oxford Bulletin of Economics and Statistics, 72(1), 109-118
Lye, J. and J. Hirschberg (2018), "Ratios of Parameters: Some Econometric Examples," Australian Economic Review, 51(4), 578-602
Millimet, D.L., J.A. List, and T. Stengos (2003), "The Environmental Kuznets Curve: Real Progress or Misspecified Models?" Review of Economics and Statistics, 85, 1038-1047
Mincer, J. (1958), "Investment in Human Capital and Personal Income Distribution," Journal of Political Economy, 66(4), 281-302


